High Performance Computing at TU Delft
Published:
If you’re a researcher or student at TU Delft and you need more computational power than your laptop can offer — whether for running simulations, training machine learning models, or processing large datasets — DelftBlue and DAIC are your go-to resources.
While the documentation of the clusters can be sufficient for frequent users, for preliminary users it can be less clear especially if not used before. I tend to forget some stuff myself and always in learning mode. With the intention of best way for learning something is to teach it! This post walks you through everything you need to get connected and start working on TU Delft’s High Performance Computing (HPC) clusters.
This tutorial is aimed at the TU Delft community but can be useful as well with similar HPC systems. We will focus on running a Python script, setting up virtual environment and shell script interface.
Full documentation DelftBlue: doc.dhpc.tudelft.nl/delftblue
Full documentation DAIC: https://daic.tudelft.nl/
What is DelftBlue & DAIC?
DelftBlue is TU Delft’s supercomputer, maintained by the Delft High Performance Computing Centre (DHPC). It gives you access to hundreds of compute nodes, GPUs, and large amounts of memory — resources that would be impossible to run on a personal machine especially multiple jobs in parallel.
Both cluster uses the SLURM job scheduler, meaning you submit jobs to a queue and the system allocates resources for you automatically. This allocation usage and priority is based on your account access.
Step 1: Check Your Access
Do you already have access?
DelftBlue share is divided into Education 13% | Innovation 5% | Research 82%
- TU Delft employees (PhD candidates, postdocs, staff): you should be able to connect using your NetID for the innovation share. However, for the research share you have to request access from here DelftBlue Research Access. For the DAIC, you have to be affiliated with a contributing group see here DAIC Research Access
- BSc/MSc students: you need to request an account via this form.
- Guest researchers (non-TU Delft): follow the guest access procedure.
Your NetID is your TU Delft username (e.g., ****@tudelft.nl). Its what you will use to authenticate yourself when connecting to cluster and submitting jobs.
Step 2: Connect to the TU Delft Network (EduVPN)
Important: You cannot SSH directly into DelftBlue from outside the university network. You must first connect via VPN. SSH (Secure Shell) is a network protocol that establishes encrypted connections between computers for secure remote access.Simply it works as the connection bridge between your device and the cluster.
If you are on campus (connected to TU Delft Wi-Fi or ethernet), you can skip this step.
If you are off campus, install and connect to EduVPN with “Institute Access”:
- Download EduVPN from Download eduVPN.
- Open EduVPN and select TU Delft as your institution.
- Choose “Institute Access” (not “Secure Internet”).
- Log in with your NetID credentials.
Once connected, your machine is effectively on the TU Delft network and you can proceed.
Step 3: SSH into DelftBlue
This tutorial will be addressed for Windows, but for other systems (Linux / macOS / Android ) its not that different and details can be found in the docs.
The DelftBlue login address is:
login.delftblue.tudelft.nl
This will route you to one of four login nodes: login01, login02, login03, or login04.
On Windows
Option A — Command Prompt (Windows 10 or higher)
Windows 10+ includes SSH natively. Open Command Prompt or PowerShell and run:
ssh <netid>@login.delftblue.tudelft.nl
Replace <netid> with your actual TU Delft username. Enter your password when prompted.
Option B — GUI clients
If you prefer a graphical interface, from the documentation there are two options that are all-in-one. By all-in-one it means you can use it to ssh to the server and to manage files/folders visually rather than using command lines. So basically you can explore files like on windows and view your directory on the cluster.
- Bitvise SSH Client — combines a terminal and an SFTP file manager in one window.
- MobaXterm — another widely-used all-in-one SSH client with X11 forwarding support.
I personally use PuTTy, as a SSH terminal emulator as I got used to it. For the file transfer GUI I use FileZilla. These are just examples of personal preference, many solutions are out there.
This is how they look 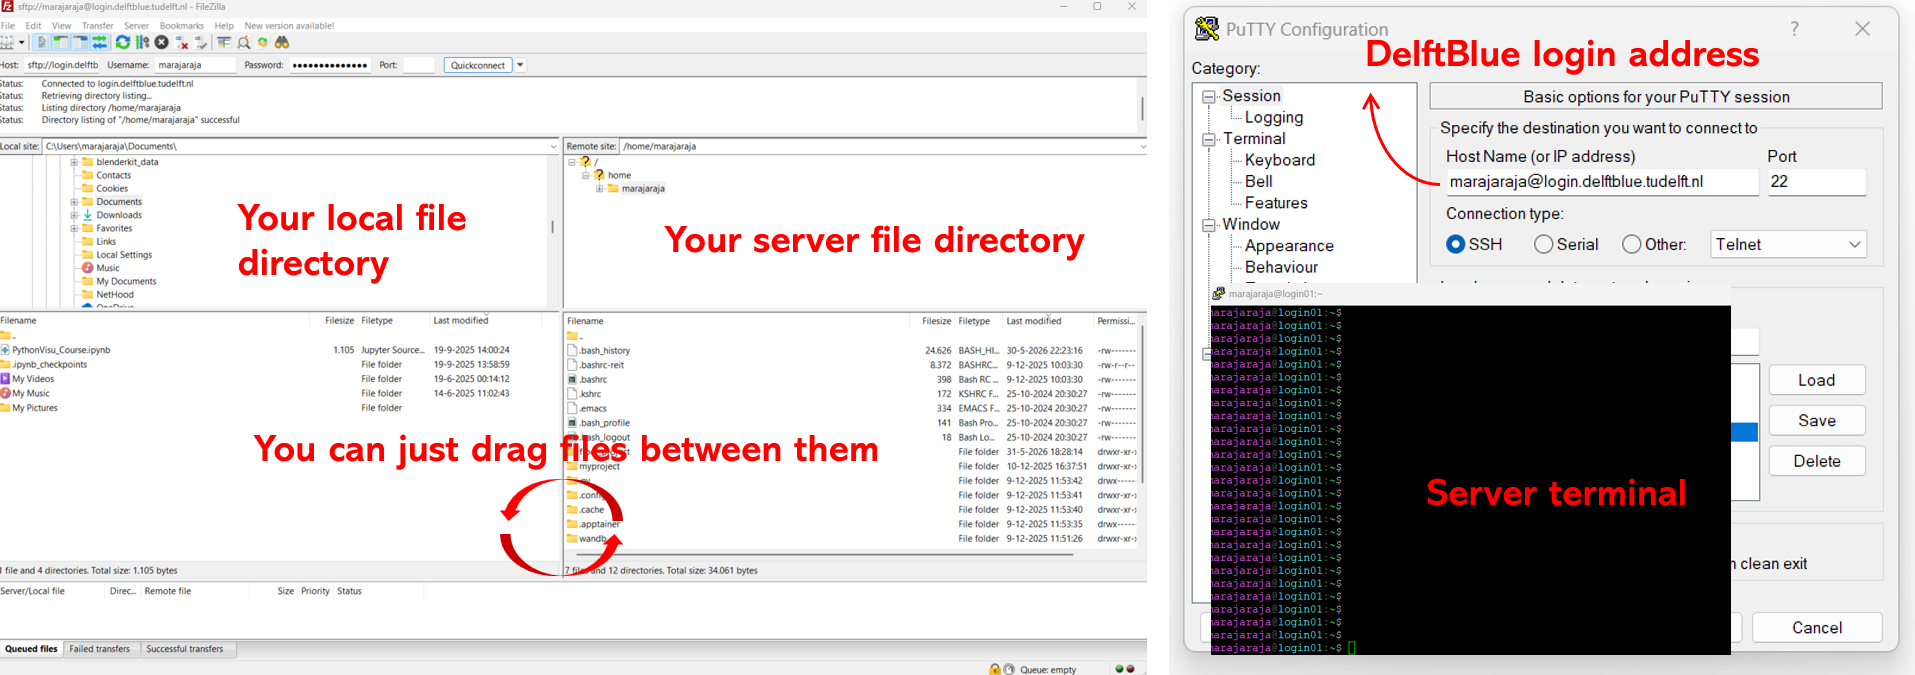
Practical Example: Running a Python ML Job on DelftBlue
Now that you’re connected, let’s walk through a real end-to-end example: setting up a Python environment and running a K-Means clustering script on the cluster.
Step A: Set Up Your Python Environment
DelftBlue does not use pip globally — instead, you create a virtual environment in your home directory. The setup is done via a batch job so it runs on a compute node with internet access to download the dependencies you need. You only have to do this once, after that your virtual env is all set and can be simply used.
Download or copy the setup script install_env.sh into your home directory on DelftBlue.
The script does the following automatically:
#!/bin/bash
#SBATCH --job-name=setup_env
#SBATCH --account=research-ae-asm      # Change to your project account
#SBATCH --partition=compute-p1
#SBATCH --ntasks=1
#SBATCH --cpus-per-task=1
#SBATCH --mem-per-cpu=1G
#SBATCH --time=00:30:00
#SBATCH --mail-type=BEGIN,END,FAIL
#SBATCH --output=setup_env_%j.out
#SBATCH --error=setup_env_%j.err

# Load modules
module load 2025
module load python/3.11.9
module load py-pip

VENV_DIR=/home/<netid>/my_venv

# Create venv if it doesn't exist
if [ ! -d "$VENV_DIR" ]; then
    python -m venv $VENV_DIR
fi

source $VENV_DIR/bin/activate
python -m pip install --upgrade pip
python -m pip install numpy pandas matplotlib seaborn scipy scikit-learn

# Sanity check
python -c "import numpy, pandas, matplotlib, sklearn; print('All packages OK!')"
Key points:
module load 2025andmodule load python/3.11.9make Python available — always load modules before using them.VENV_DIRis a persistent directory in your home folder. It survives between jobs.- Change
--accountto match your project/department allocation.
Submit the setup job:
# sbatch command is used to submit a batch script to Slurm
sbatch install_env.sh
To Check the job status use squeue
When the job completes, inspect the output log to confirm everything installed. You can transfer the .out and .err files to your local directory and inspect them there on your device. Our use the command cat. Some useful command lines can be found below.
| Command | Primary Function | Common Flags / Usage |
|---|---|---|
cd | Change working directory | cd /path/to/project |
ls | List directory contents | ls -la (shows file sizes and hidden files) |
nano | Create or edit text files | nano script.sh |
cat | Print file content to terminal | cat slurm-[id].out |
less | Scroll through long files line-by-line | less slurm-[id].out (press q to exit) |
sbatch | Submit a batch script to the queue | sbatch script.sh |
squeue | Check status of running/pending jobs | squeue -u $USER |
scancel | Cancel a specific job or all user jobs | scancel [job_id] |
scontrol | View or modify detailed job/node states | scontrol show job [job_id] |
sinfo | View partition and node status | sinfo -p [partition] |
srun | Run interactive jobs or parallel steps | srun --pty bash |
sacct | View accounting data for past jobs | sacct -j [job_id] |
sprio | View factors determining job priority | sprio -u $USER |
Important: You do not have to setup the environment and reinstall packages every time you run scripts, its all set and can be found in your DelftBlue directory. All you have to do is just activate it every session via:
source ~/my_venv/bin/activate
Once activated the terminal will show:
(my_venv) <netid>>@login01:~$
Step B: Submitting the Python Script
Once the environment is ready, we can submit the analysis script. This example is based on a K-Means clustering workflow — a classic unsupervised machine learning algorithm that groups data points into k clusters by minimizing the distance to cluster centroids.
Save this as kmeans_job.py in your home directory on DelftBlue:
# kmeans_job.py
# K-Means Clustering on DelftBlue
# Based on: https://scikit-learn.org/stable/modules/clustering.html#k-means

import matplotlib
matplotlib.use('Agg')  # Non-interactive backend — required on HPC (no display)
import matplotlib.pyplot as plt
from sklearn.datasets import make_blobs
from sklearn.cluster import KMeans

# ── 1. Generate synthetic dataset ──────────────────────────────────────────
X, y_true = make_blobs(
    n_samples=150, n_features=2,
    centers=3, cluster_std=0.5,
    shuffle=True, random_state=0
)

# ── 2. Fit K-Means (k=3) ───────────────────────────────────────────────────
km = KMeans(
    n_clusters=3, init='random',
    n_init=10, max_iter=300,
    tol=1e-04, random_state=0
)
y_km = km.fit_predict(X)
print(f"Inertia (distortion): {km.inertia_:.4f}")

# ── 3. Plot clusters and centroids ─────────────────────────────────────────
colors  = ['lightgreen', 'orange', 'lightblue']
markers = ['s', 'H', 'v']

fig, axes = plt.subplots(1, 2, figsize=(12, 5))

for i in range(3):
    axes[0].scatter(
        X[y_km == i, 0], X[y_km == i, 1],
        s=50, c=colors[i], marker=markers[i],
        edgecolor='black', label=f'Cluster {i}'
    )
axes[0].scatter(
    km.cluster_centers_[:, 0], km.cluster_centers_[:, 1],
    s=250, marker='*', c='red', edgecolor='black', label='Centroids'
)
axes[0].set_title('K-Means Clustering (k=3)')
axes[0].legend()
axes[0].grid(True)

# ── 4. Elbow method — find optimal k ──────────────────────────────────────
distortions = []
k_range = range(1, 11)
for k in k_range:
    km_elbow = KMeans(n_clusters=k, init='random', n_init=10,
                      max_iter=300, tol=1e-04, random_state=0)
    km_elbow.fit(X)
    distortions.append(km_elbow.inertia_)

axes[1].plot(k_range, distortions, marker='o')
axes[1].set_xlabel('Number of clusters (k)')
axes[1].set_ylabel('Distortion (inertia)')
axes[1].set_title('Elbow Method')
axes[1].grid(True)

plt.tight_layout()
plt.savefig('kmeans_results.png', dpi=150)
print("Plot saved to kmeans_results.png")
Why
matplotlib.use('Agg')? Login and compute nodes have no screen/display attached. TheAggbackend renders figures to file instead of trying to open a window — without it the script will crash.
Step C: Create the Slurm Batch Script to submit the Python File
Create run_kmeans.sh to submit the Python script as a job:
#!/bin/bash
#SBATCH --job-name=kmeans
#SBATCH --account=research-ae-asm      # Change to your project account
#SBATCH --partition=compute-p1
#SBATCH --ntasks=1
#SBATCH --cpus-per-task=1              # sklearn can use multiple cores. However, this is a very compute-friendly example — it finishes in less than a minute
#SBATCH --mem-per-cpu=2G
#SBATCH --time=00:10:00
#SBATCH --mail-type=BEGIN,END,FAIL
#SBATCH --output=kmeans_%j.out
#SBATCH --error=kmeans_%j.err

# --- Load the DelftBlue software stack ---
module load 2025
module load python/3.11.9

# --- Activate your persistent virtual environment ---
source /home/<netid>/my_venv/bin/activate

# --- Navigate to your project directory ---
cd /home/<netid>/

# --- Log job metadata for reproducibility ---
echo "=========================================="
echo "[JOB INFO]"
echo "Node hostname: $(hostname)"
echo "Job ID: $SLURM_JOB_ID"
echo "Submitted by: $USER"
echo "Started at: $(date)"
echo "=========================================="
echo ""
echo "[ENVIRONMENT INFO]"
which python
python --version
pip list | grep -E 'numpy|pandas|matplotlib|seaborn|scipy|scikit-learn'
echo "=========================================="
echo ""

# --- Run the K-Means script ---
echo "[RUNNING] K-Means clustering script..."
srun python kmeans_job.py

# --- Log job completion ---
echo ""
echo "=========================================="
echo "[JOB COMPLETED]"
echo "Finished at: $(date)"
echo "=========================================="
Submit it:
sbatch run_kmeans.sh
Monitor progress:
squeue -u <netid>          # check job status
tail -f kmeans_<jobid>.out # stream live output
Step D: Retrieve the Results
Once the job is COMPLETED, copy the output plot back to your local machine. I also frequently save data resulting from the analysis in a .joblib file and load the data on my machine. This way you can customize the figures easily and promptly.
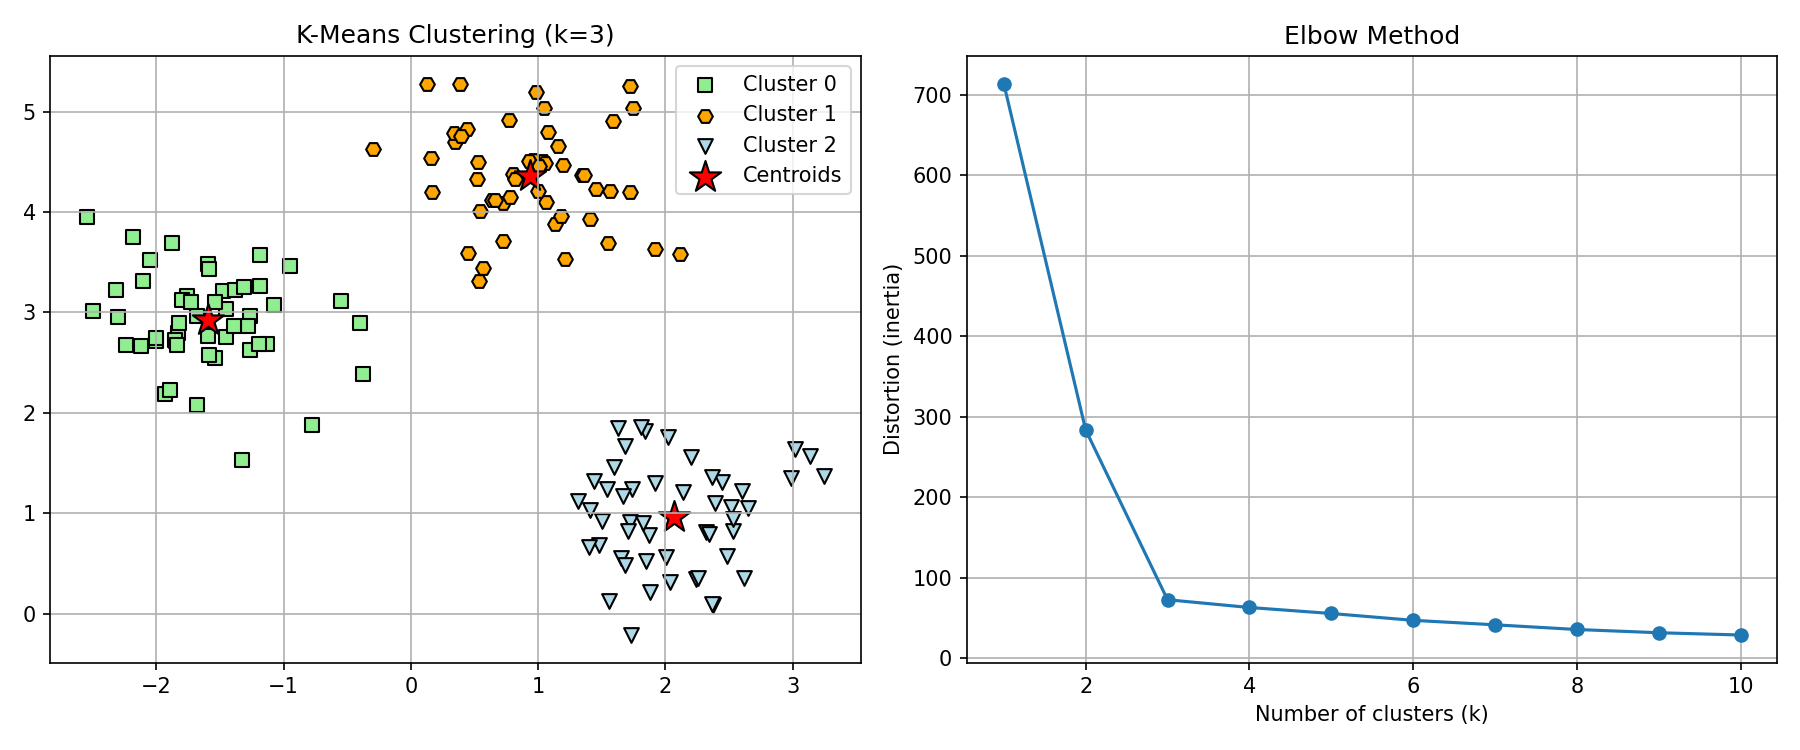
The output should look like this — three well-separated clusters on the left, and the elbow at k = 3 confirming the optimal number of clusters on the right:
Summary of the Full Workflow
This pattern — prepare locally, submit via sbatch, retrieve results — applies to any Python workflow, whether it is a simple script, a heavy simulation, or a deep learning training run.
Acknowledgment
DelftBlue: doc.dhpc.tudelft.nl/delftblue
DAIC: https://daic.tudelft.nl/
Scikit-learn: scikit-learn: machine learning in Python